

From
visual
Get Started for FREE
Sign up with Facebook Sign up with X
I don't have a Facebook or a X account


 Your new post is loading...
 Your new post is loading...
Your new post is loading...
From
visual
Dr. Pamela Rutledge's insight:
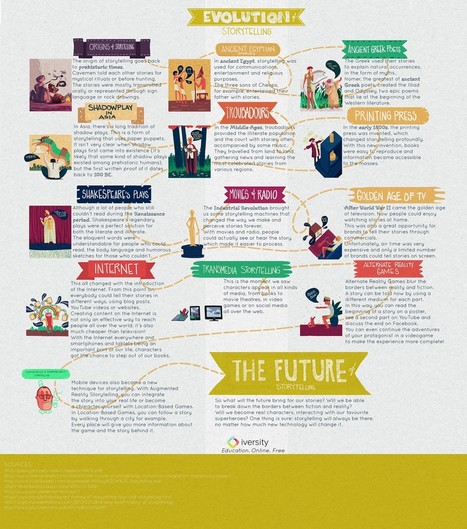
Great infographic on storytelling! Every stage of technology amplifies the input to the brain, increasing our multi-sensory experience. The chart says ARGs blur the line between fantasy and reality, but our ability to project emotions and presence (i.e. narrative transportation) have allowed us to blur that line from the beginning in a well-told story. 
|
Infographics are interesting–a mash of (hopefully) easily-consumed visuals (so, symbols, shapes, and images) and added relevant character-based data (so, numbers, words, and brief sentences). The learning application for them is clear, with many academic standards–including the Common Core standards–requiring teachers to use a variety of media forms, charts, and other data for both information reading as well as general fluency... Via Baiba Svenca
Dr. Pamela Rutledge's insight:
Infographics - the power of storytelling with data.

maite collados's curator insight,
January 14, 2014 11:24 AM
Las infografías son una herramienta muy útil por su factor visual: en poco espacio y de forma visulamente agradable y atrayente, engloba datos y relaciona conceptos. 
ManufacturingStories's curator insight,
July 30, 2014 7:50 AM
For more resources on Social Media & Content Curation visit http://bit.ly/1640Tbl |


I have a Slideshare that aligns with this, based on my experience with the young adult multi-platform novel, Kiss Kill.
Found at:http://www.slideshare.net/jenimawter/the-future-of-story-telling-transmedia-toe-dipping-2013
Very interesting infographic about storytelling. It shows really relevant present approaches that must be seriously considered in education
Genial!